Analysis
Products
Learn more about each of the products TKL offers included with every subscription.
Featured by these leading companies
Analysis
Chart of the Week
Over 60% of daily trading activity in the stock market is automated, according to recent data.
The rise of algorithmic trading has only strengthened the power of technical analysis. As key technical levels are being tested, we are seeing volume drive price.
Our goal with the Chart of the Week is to get ahead of these large moves and guide subscribers with our technical roadmap.
The rise of algorithmic trading has only strengthened the power of technical analysis. As key technical levels are being tested, we are seeing volume drive price.
Our goal with the Chart of the Week is to get ahead of these large moves and guide subscribers with our technical roadmap.
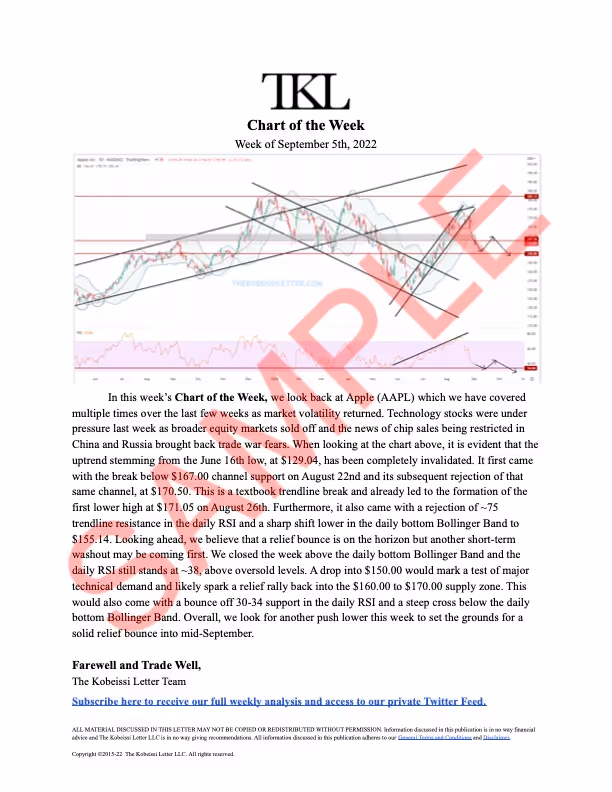
Chart of the Week Sample - September 5th, 2022
Key Features
Weekly Updates
The Chart of the Week contains new content and analysis every week, uploaded at the same time.
Learn to Chart
Learn how we chart as leaders in technical analysis by reading every week.
Technical Roadmap
See how we use technicals to define trends and follow technical supply and demand around pivot points
Free with Membership
Every member gets the Chart of the Week sent to their inbox for FREE, no subscription required.
Key Industries
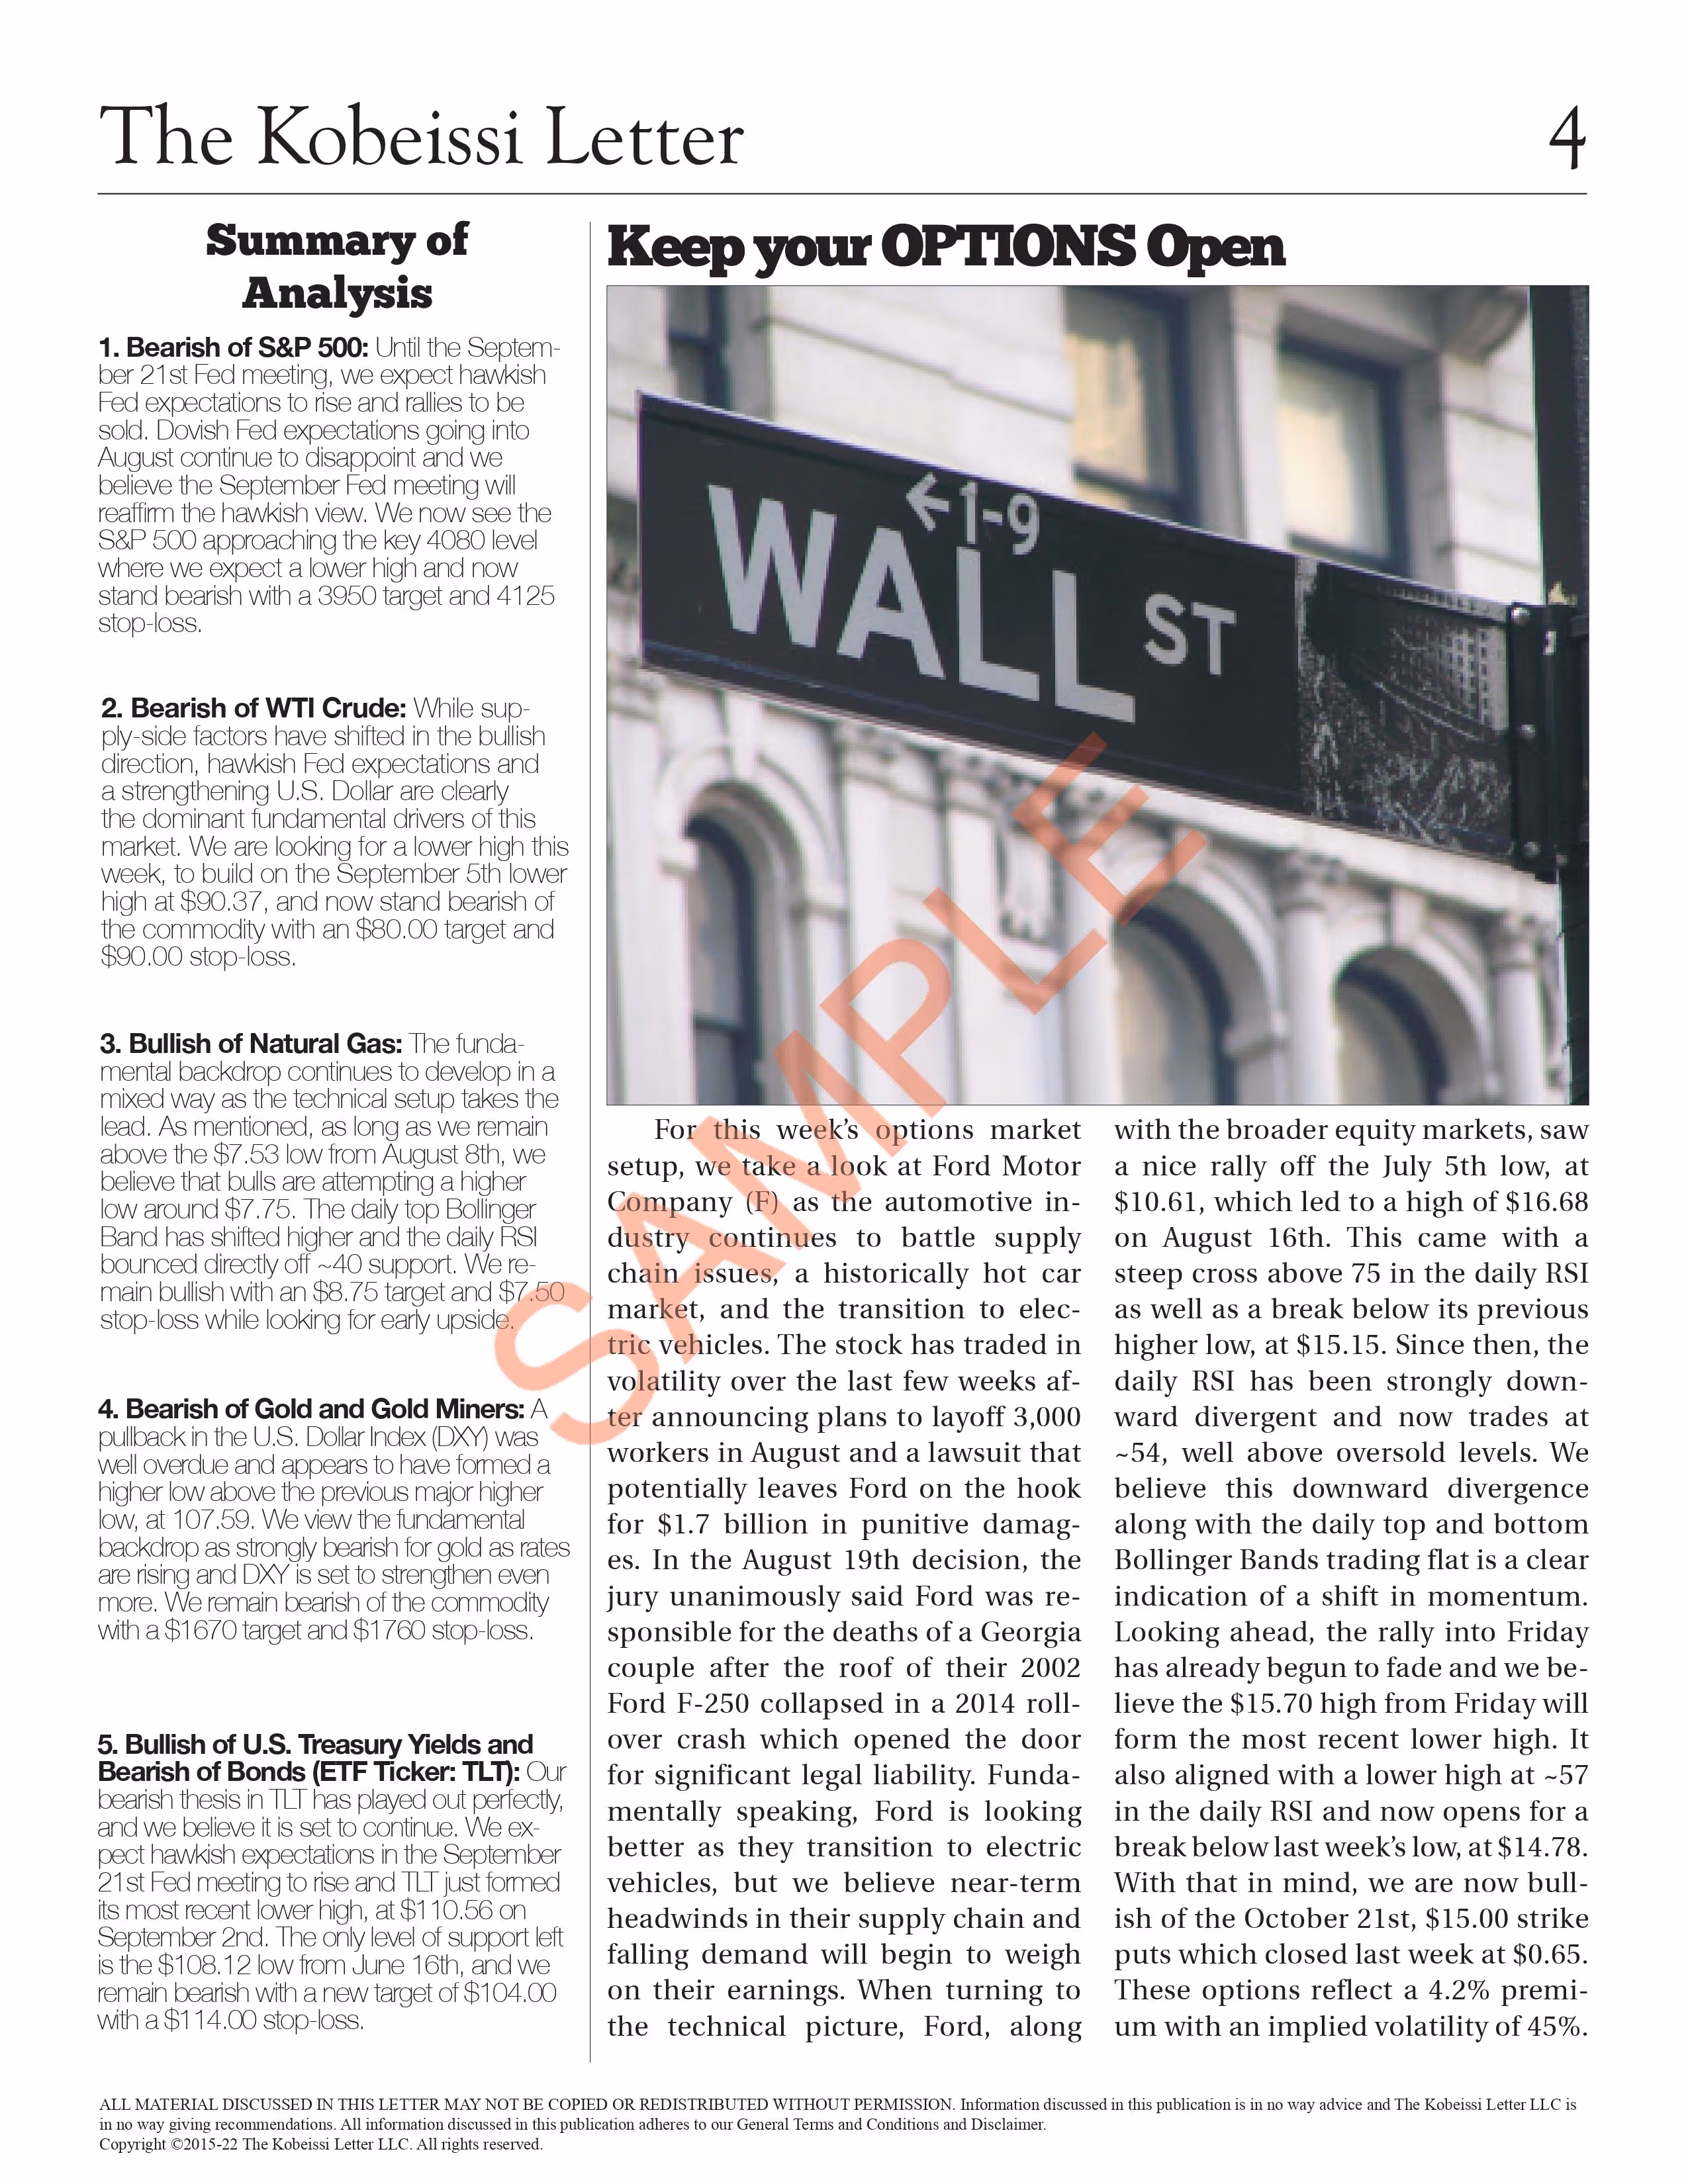
S&P 500
Views from a fundamental and technical perspective including our targets, stops and the macroeconomic trends to watch.
Crude Oil
Insights on key fundamental developments in the crude oil markets along with our targets, stops and a technical roadmap for traders.
Natural Gas
Important fundamental developments and our technical playbook on natural gas, one of the most technical assets in the market.
Gold
See how our outlook for the U.S. Dollar and other macroeconomic trends helps determine direction, along with our technical analysis.
Bonds
Increasingly Fed and data focused, which we build into our analysis, along with technical targets and stops that we outline each week.
Options
Our weekly options pick complements our views in the other sections as we look to capitalize on implied volatility.
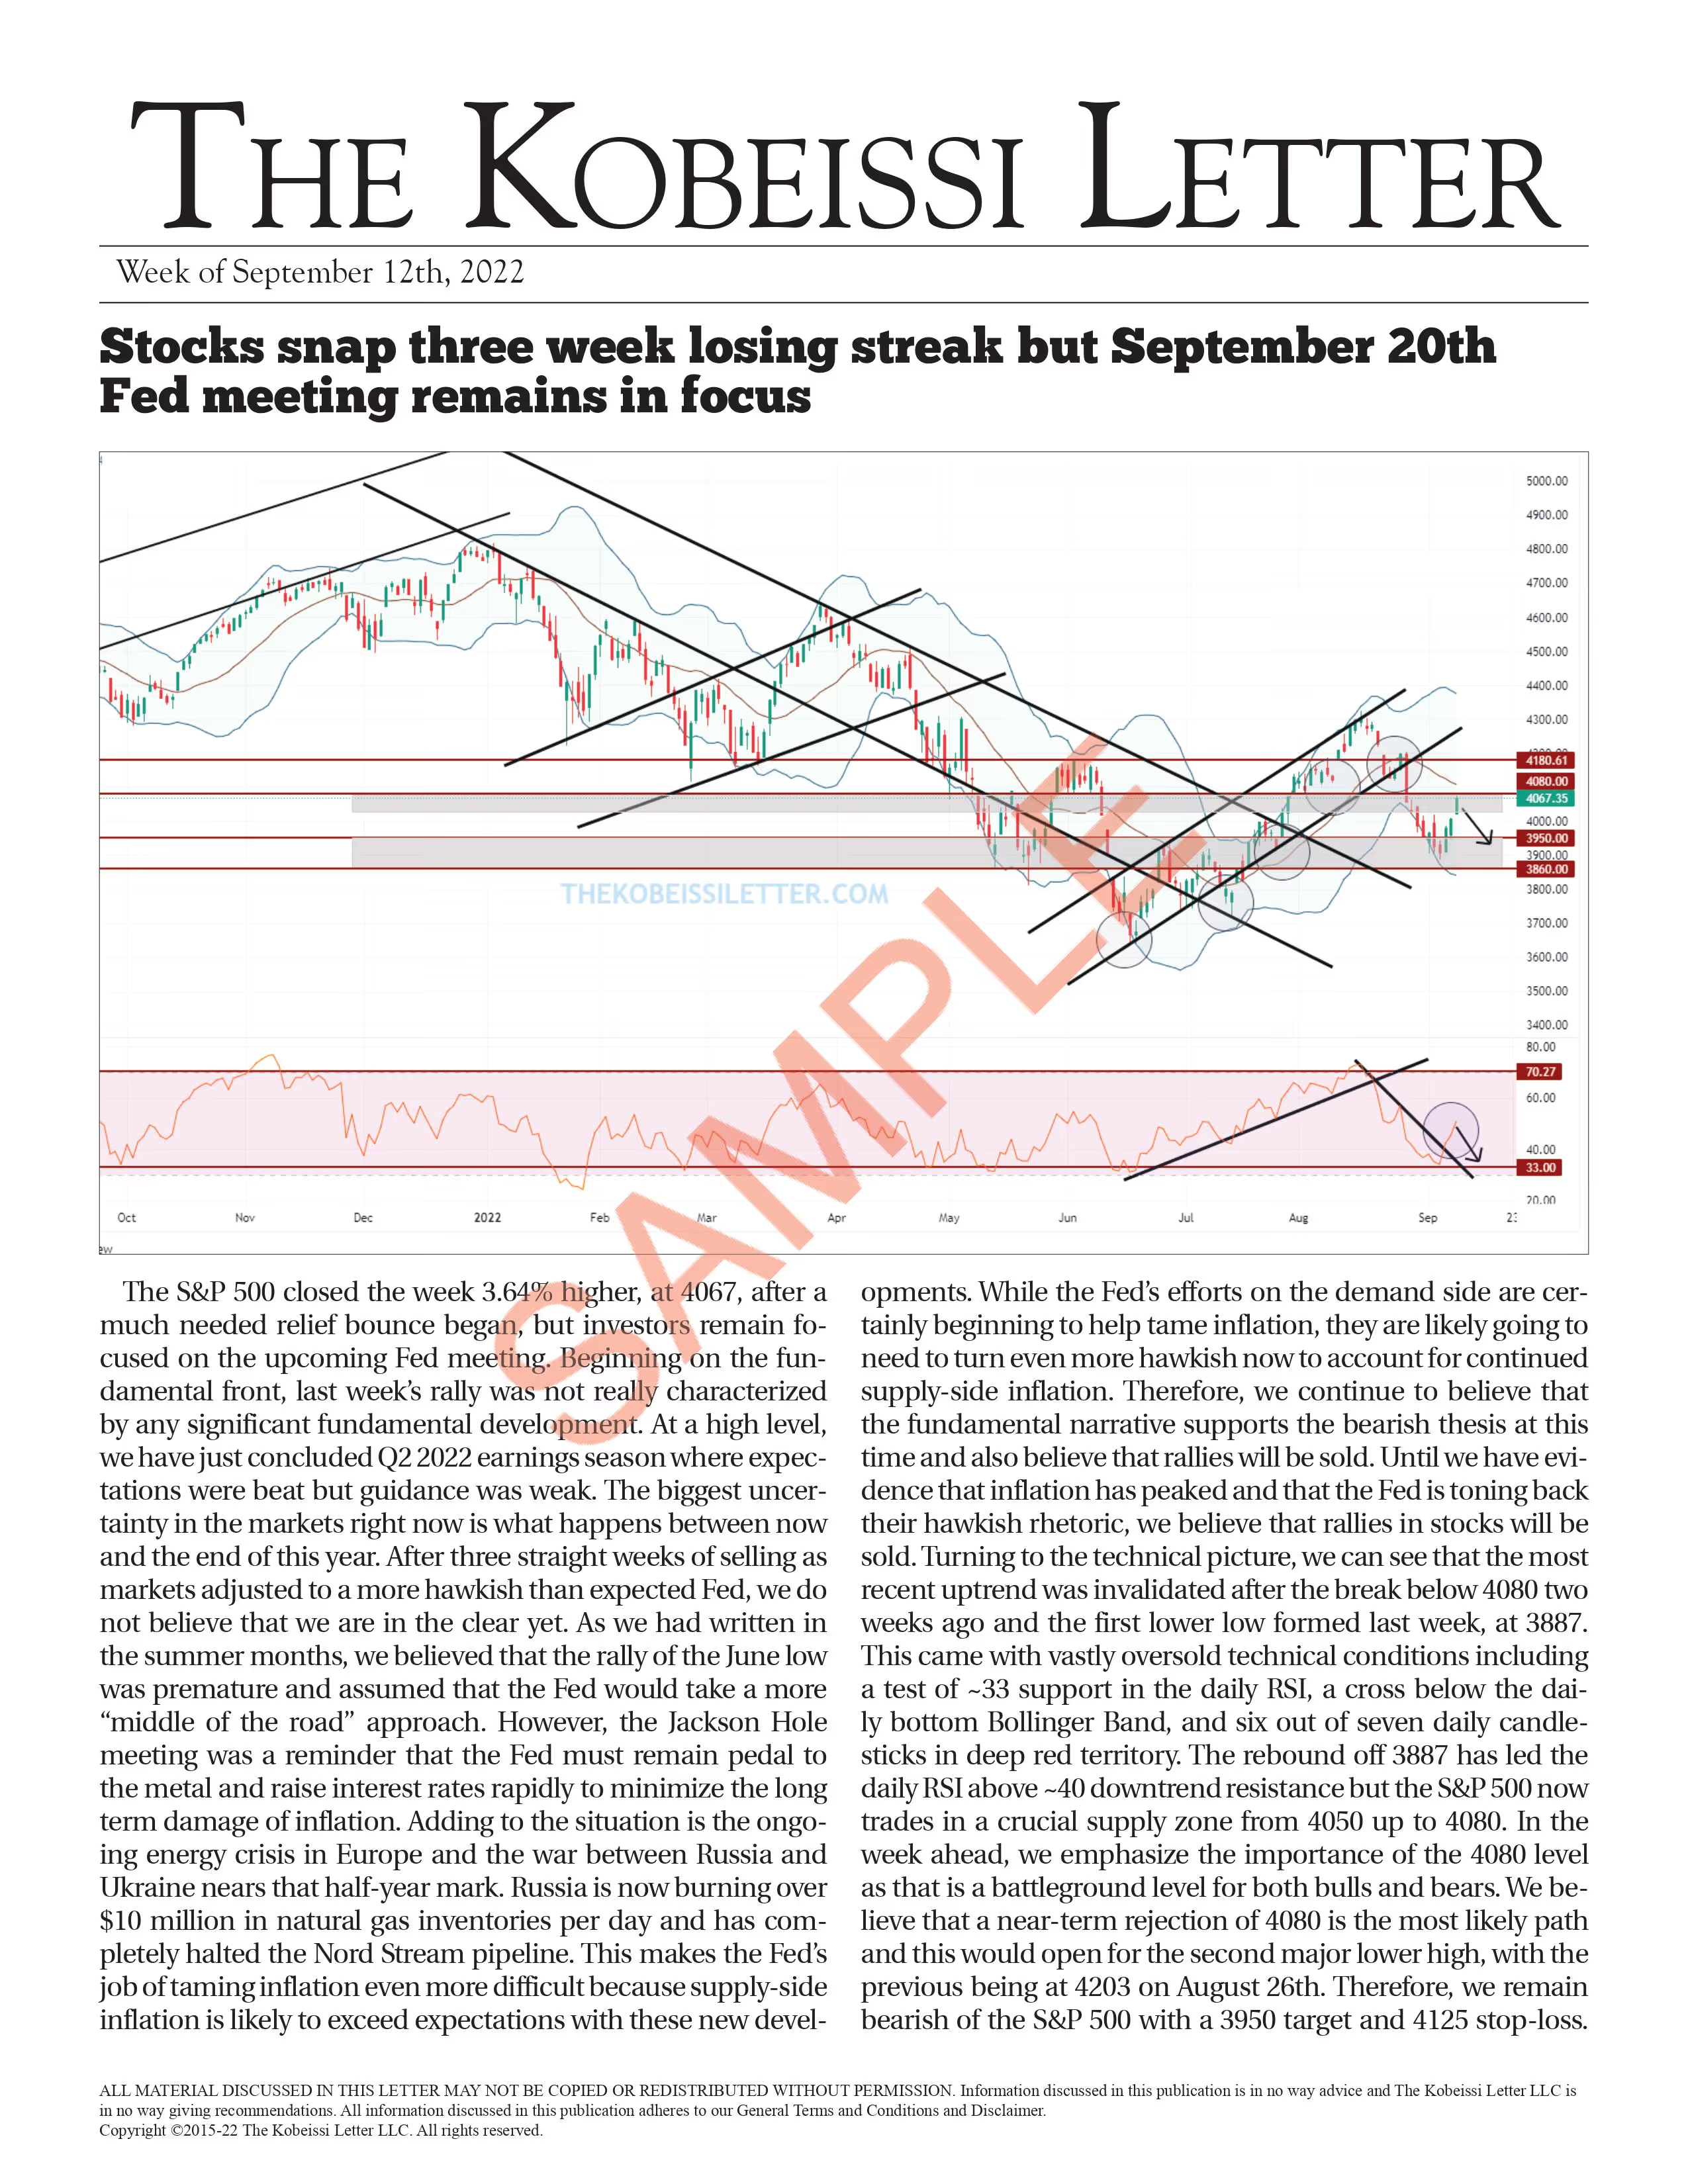
The Kobeissi Letter Sample - September 12th, 2022
Analysis
The Kobeissi Letter
Our subscription-based weekly newsletter provides TKL’s views on the S&P 500, Crude Oil, Natural Gas, Gold, Bonds and Options.
Subscribers also receive access to our Private Twitter Feed for intra-week updates on the same topics in the newsletter.
Subscribers also receive access to our Private Twitter Feed for intra-week updates on the same topics in the newsletter.

20+ years
Active Trading Experience

75k+ followers
@MasterPandaWu's Social Media Audience
Analysis
Master Panda Wu : Independent Contributor
A professor, author & editor-in-chief of a financial media outlet, providing you with educational trading information, backed by experience.
Get access to his TEACT Model, a multi-factored model meant to best capture economic activities and human psychology.
Get access to his TEACT Model, a multi-factored model meant to best capture economic activities and human psychology.
Key Model Features
Elliot Wave Theory
This statistically logical pattern comes as five recognizable waves with sideway counter corrective bounces.
Trend Factor
Combining this with EWT and Technical Analysis, investors are better prepared to make accurate short-term to long-term calls.
Astrology Factor
This statistically logical pattern comes as five recognizable waves with sideway counter corrective bounces.
Cycle Factor
From the larger 13-year cycle, to 2.2-year cycle, all the way to the smallest cycles at the 30-min level, all have their effects on the market.
TA Factor
MPW's Model uses several proprietary indicators-such as DTK red alert signal, MARP pattern-that help identify major tops and bottoms accurately.
And More...
Gain access to MPW's Educational Guide and background that helps shed light on the TEACT Model.

Search
Enter keywords and click search.